Data Analytics for Engineers
You take this course in the third quarter of the first year
General learning goals
- Students gain insight in basic techniques for processing large amounts of data in an efficient, reliable, and consistent way.
- Students develop skills in understanding, interpreting, and documenting data and information in the context of realistic scenarios.
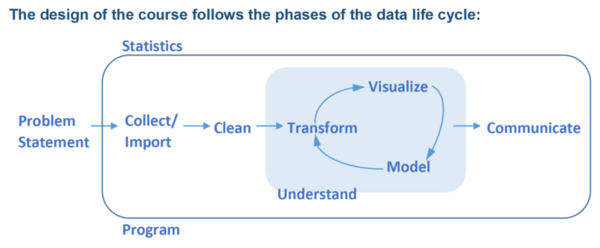
- Students get understanding of the data life cycle and develop skills for structuring their solutions of practical problems along the phases of the data life cycle.
- Students apply data analytics techniques to realistic data sets in which they can recognize the demands within their area of specialization.
- Students obtain basic knowledge of statistical concepts and techniques and develop skills to apply them in practice.
- Students learn to implement their solutions for data analytics problems in a programming language (Python), and apply a structured and systematic approach to data processing.
Students learn
- To use basic statistical concepts and techniques (like the mean, median, mode, percentile, range, variance, confidence intervals, p-value, correlation, and t-test).
- To read database schemes and write simple queries to a data base in SQL.
- To clean data (missing values, duplicates, and outlier detection).
- To choose and apply data transformations (normalization, aggregation), data reduction, and data discretion.
- To choose and apply suitable visualization techniques (like line graphs, bar charts, scatter plots, pie charts, box plots, violin plots, and heat maps).
- To analyze and model data (linear regression, clustering, decision tree mining, association rules learning).
- To choose and communicate interesting findings in the language understandable for their end user (visually or textually).
- To use tools for implementing data engineering tasks (Excel in week 1, and Python with Jupiter Notebooks during the rest of the course).
- To implement their solutions in Python using a structured approach to programming.
Students will also learn to estimate the consequences of choices made for the other phases of data processing. The interpretation of results is considered in every phase of the analysis.
Course setup
- One lecture of two hours per week during 7 weeks.
- Online homework, including self-study based on screencasts and tutorials and exercises in OnCourse (part of graded homework).
- Two practicum sessions of two hours per week during 7 weeks.
Grading
- Written exam – 50% of the final grade.
- Two graded assignments – 20% of the final grade per assignment. Students work on realistic data analytics problems.
- Online exercises – 10% of the final grade.